MATLAB练习例子六(多项式和插值)
返回
多项式和插值
》 A = [9 4; 6 8; 2 7]
A =
9 4
6 8
2 7
》 [U,S,V] = svd(A)
U =
0.6105 -0.7174 0.3355
0.6646 0.2336 -0.7098
0.4308 0.6563 0.6194
S =
14.9359 0
0 5.1883
0 0
V =
0.6925 -0.7214
0.7214 0.6925
》 [U,S,V] = svd(A,0)
U =
0.6105 -0.7174
0.6646 0.2336
0.4308 0.6563
S =
14.9359 0
0 5.1883
V =
0.6925 -0.7214
0.7214 0.6925
》 p = [1 0 -2 -5]
p =
1 0 -2 -5
》 r = roots(p)
r =
2.0946
-1.0473 + 1.1359i
-1.0473 - 1.1359i
》 p2 = poly(r)
p2 =
1.0000 -0.0000 -2.0000 -5.0000
》 A = [1.2 3 -0.9; 5 1.75 6; 9 0 1];
》 poly(A)
ans =
1.0000 -3.9500 -1.8500 -163.2750
》 polyval(p,5)
ans =
110
》 X = [2 4 5; -1 0 3; 7 1 5];
》 Y = polyvalum(p,X)
??? 'polyvalum' は未定義の関数、または変数です.
》 Y = polyvalm(p,X)
Y =
377 179 439
111 81 136
490 253 639
》
卷积,反卷积
》 a = [1 2 3];
》 b = [4 5 6];
》 c = conv(a,b)
c =
4 13 28 27 18
》 [q,r] = deconv(c,a)
q =
4 5 6
r =
0 0 0 0 0
多项式导数
》 p = [1 0 -2 -5];
》 q = polyder(p)
q =
3 0 -2
》 a=[1 3 5];
》 b=[2 4 6];
》 c = polyder(a,b)
c =
8 30 56 38
》 [q,d] = polyder(a,b)
q =
-2 -8 -2
d =
4 16 40 48 36
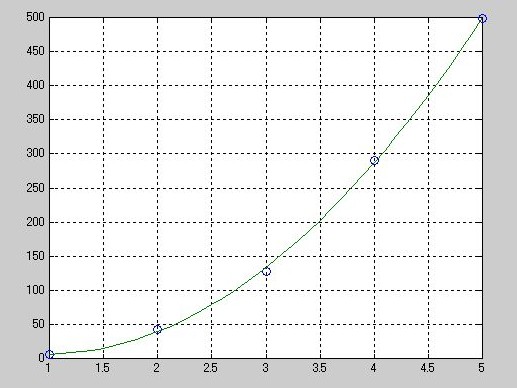
曲线拟合
》 x = [1 2 3 4 5]; y=[5.5 43.1 128 290.7 498.4];
》 p = polyfit(x,y,3)
p =
-0.1917 31.5821 -60.3262 35.3400
》 x2=1:.1:5;
》 y2=polyval(p,x2);
》 plot(x,y,'o',x2,y2)
》 grid on
》
部分分式展开
》 b = [-4 8];
》 a = [1 6 8];
》 [r,p,k]=residue(b,a)
r =
-12
8
p =
-4
-2
k =
[]
》 [b2,a2] = residue(r,p,k)
b2 =
-4 8
a2 =
1 6 8
-
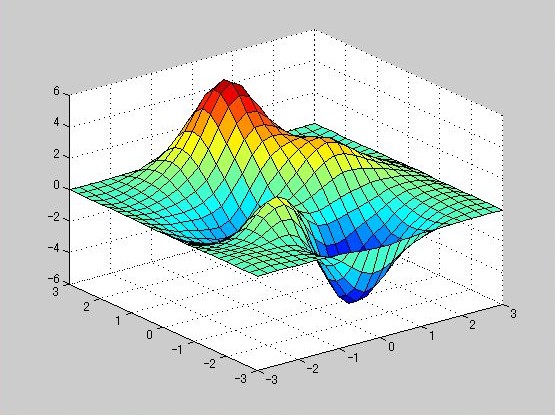
比较不同的插值方法
》 [x,y] = meshgrid(-3:1:3);
》 z = peaks(x,y);
》 surf(x,y,z)
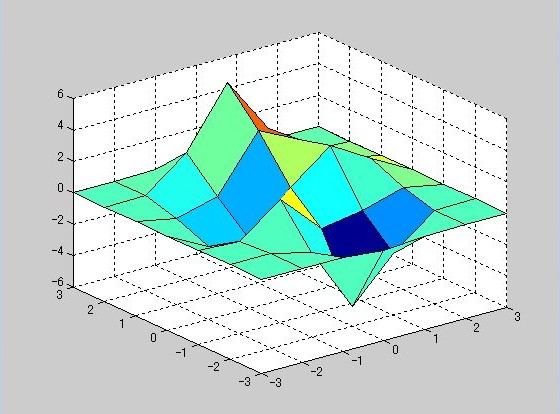
》 [xi,yi] = meshgrid(-3:0.25:3);
》 zi1 = interp2(x,y,z,xi,yi,'nearest');
》 surf(xi,yi,zi1)
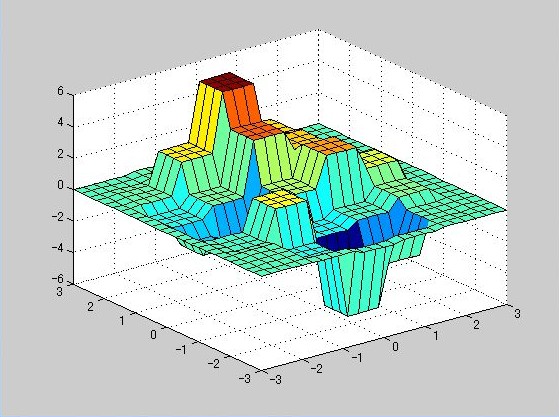
》 zi2 = interp2(x,y,z,xi,yi,'bilinear');
》 surf(xi,yi,zi2)
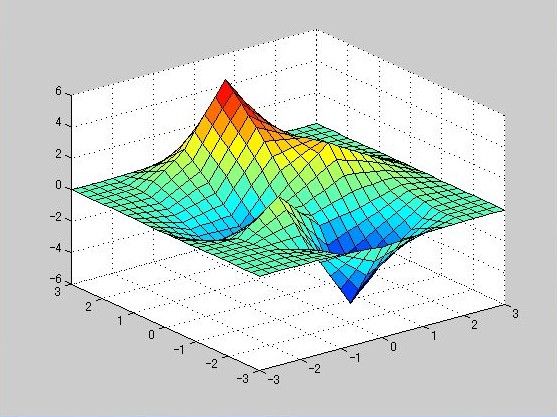
》 zi3 = interp2(x,y,z,xi,yi,'bicubic');
》 surf(xi,yi,zi3)
多维数据
》 x1 = -2:0.2:2;
》 x2 = -2:0.25:2;
》 x3 = -2:0.16:2;
》 [X1,X2,X3] = ndgrid(x1,x2,x3);
》 z = X2.*exp(-X1.^2 - X2^2 - X3.^2);
??? エラー: ==> ^
引数引数は2-Dである必要があります.
》 z = X2.*exp(-X1.^2 - X2.^2 - X3.^2);
》 slice(X2,X1,X3,z,[-1.2.8 2],2,[-2 0.2])
》
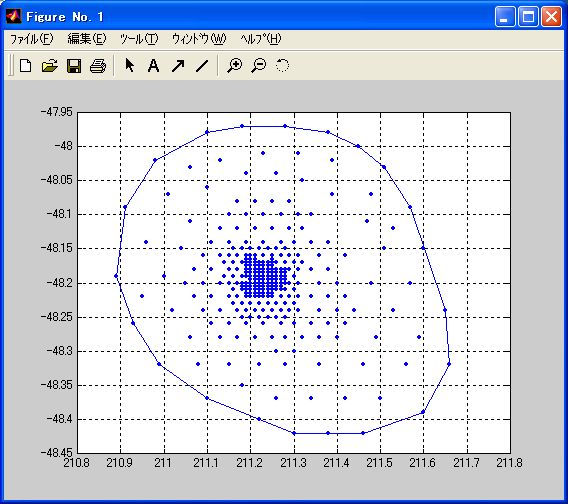
凸形外壳
》 load seamount
》 plot(x,y,'.','markersize',10)
》 k = convhull(x,y);
》 hold on, plot(x(k),y(k)), hold off
》 grid on
》
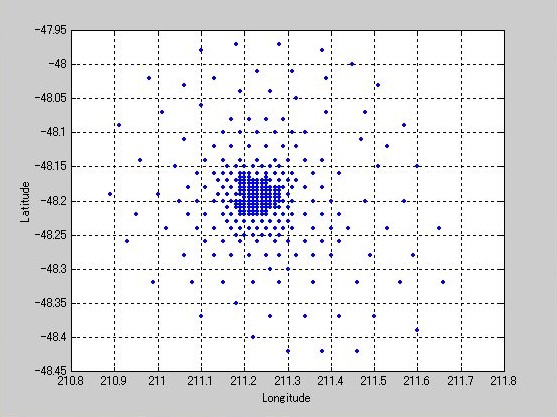
 德朗奈测量(Delaunay triangulation)
》 load seamount
》 plot(x,y,'.','markerisize',12)
??? エラー: ==> plot
Invalid line property: 'markerisize'.
》 plot(x,y,'.','markersize',12)
》 xlabel('Longitude'),ylabel('Latitude')
》 grid on
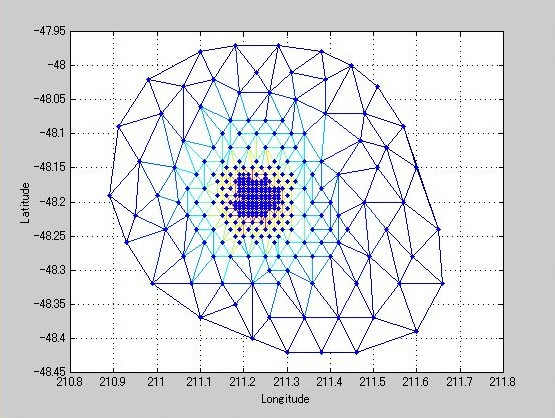
德朗奈测量(Delaunay triangulation)
》 load seamount
》 plot(x,y,'.','markerisize',12)
??? エラー: ==> plot
Invalid line property: 'markerisize'.
》 plot(x,y,'.','markersize',12)
》 xlabel('Longitude'),ylabel('Latitude')
》 grid on
 》 tri=delaunay(x,y);
》 hold on, trimesh(tri,x,y,z), hold off
》 xlabel('Longitude'); ylabel('Latitude')
》 tri=delaunay(x,y);
》 hold on, trimesh(tri,x,y,z), hold off
》 xlabel('Longitude'); ylabel('Latitude')
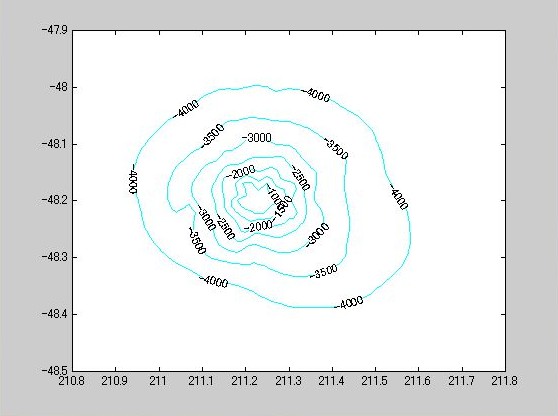
 》 [xi,yi] = meshgrid(210.8:.01:211.8,-48.5:.01:-47.9);
》 zi=griddata(x,y,z,xi,yi,'cubic');
》 [c,h] = contour(xi,yi,zi,'c-'); clabel(c,h)
》 [xi,yi] = meshgrid(210.8:.01:211.8,-48.5:.01:-47.9);
》 zi=griddata(x,y,z,xi,yi,'cubic');
》 [c,h] = contour(xi,yi,zi,'c-'); clabel(c,h)
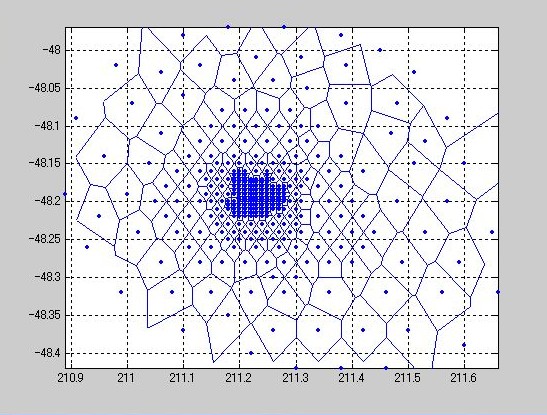
 》 load seamount
》 voronoi(x,y)
》 grid on
棋盘形布置
》 d = [-1 1];
》 [x,y,z] = meshgrid(d,d,d);
》 X = [x(:),y(:),z(:)];
》 C = convhulln(X)
??? 'convhulln' は未定義の関数、または変数です.
》 X(9,:) = [0 0 0];
》 T =delaunayn(X)
??? 'delaunayn' は未定義の関数、または変数です.
》 load seamount
》 voronoi(x,y)
》 grid on
棋盘形布置
》 d = [-1 1];
》 [x,y,z] = meshgrid(d,d,d);
》 X = [x(:),y(:),z(:)];
》 C = convhulln(X)
??? 'convhulln' は未定義の関数、または変数です.
》 X(9,:) = [0 0 0];
》 T =delaunayn(X)
??? 'delaunayn' は未定義の関数、または変数です.
返回